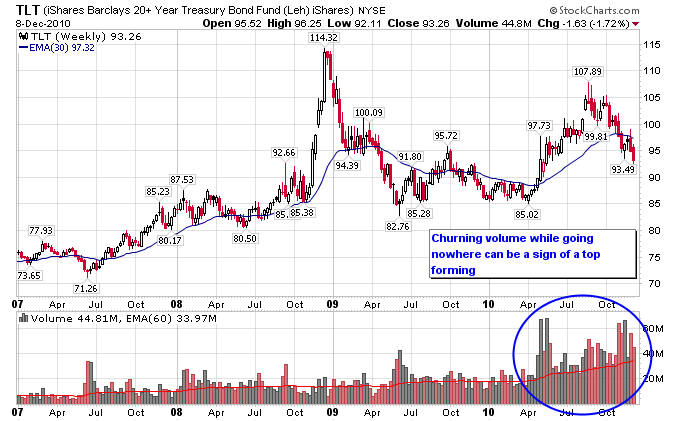
Starting from the long end of the yield curve and working backwards, bonds have started moving lower. The first chart shows TLT, an ETF that tracks long term government bonds. The price of TLT has moved below the 30-week moving average once again. Another thing to note is the big increase in volume without a significant move in price. Often times when a market churns on heavy volume and doesn’t continue advancing, especially at the end of a long rally, it can signal a top forming.
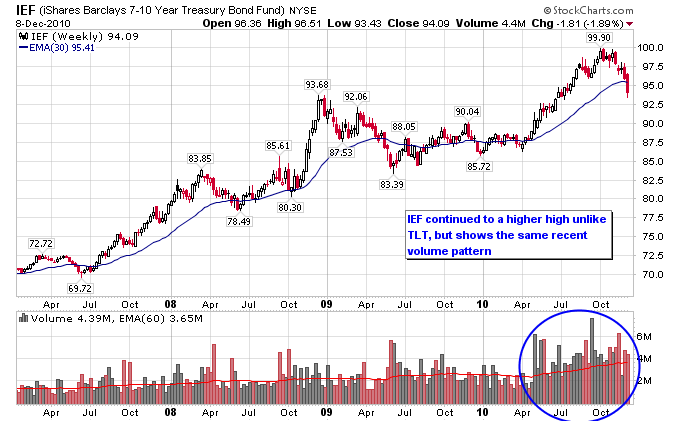
The next chart shows IEF, an ETF that tracks 7-10 year treasury bonds. IEF made another new high recently unlike TLT, but it is also showing the same churning volume pattern at the recent high. IEF has also broken below the 30-week moving average.
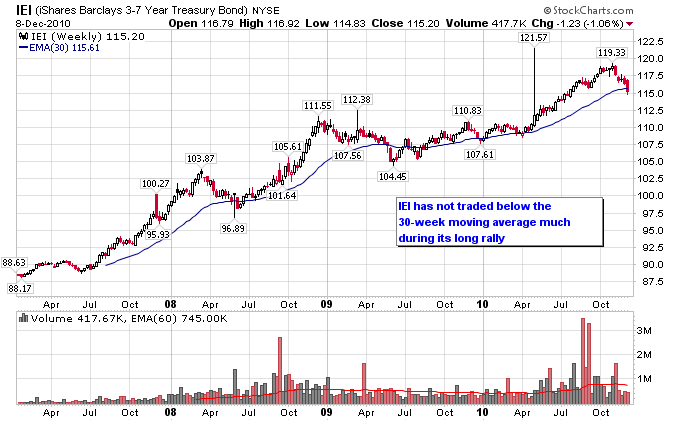
Finally we have IEI, an ETF that tracks 3-7 year government bonds. Like IEF, IEI has started to break below its 30-week moving average this week. IEI has done very little trading below the 30-week moving average so a break below it that holds would be a technically significant event.


