The following is a guest post from one of the top Stage Analysis websites on the Internet, www.stageanalysis.net. Check out their forum with tons of valuable info on Weinstein style trading!
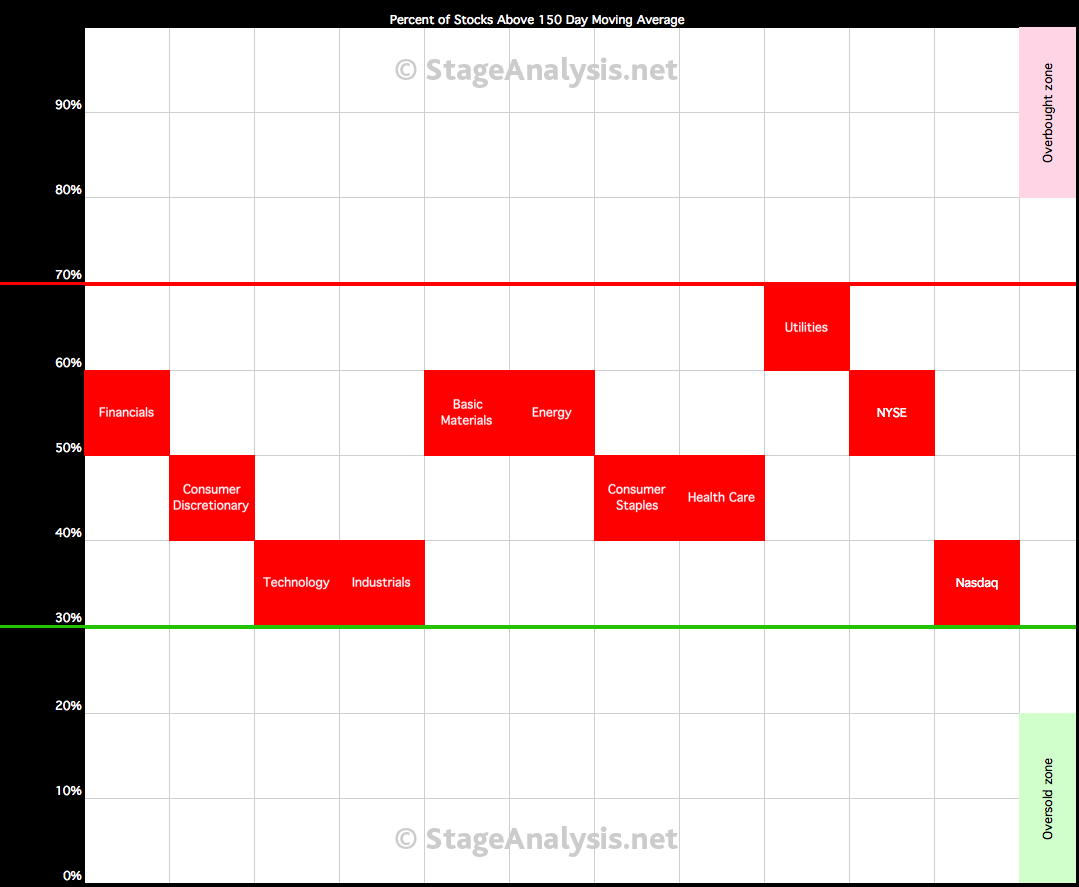
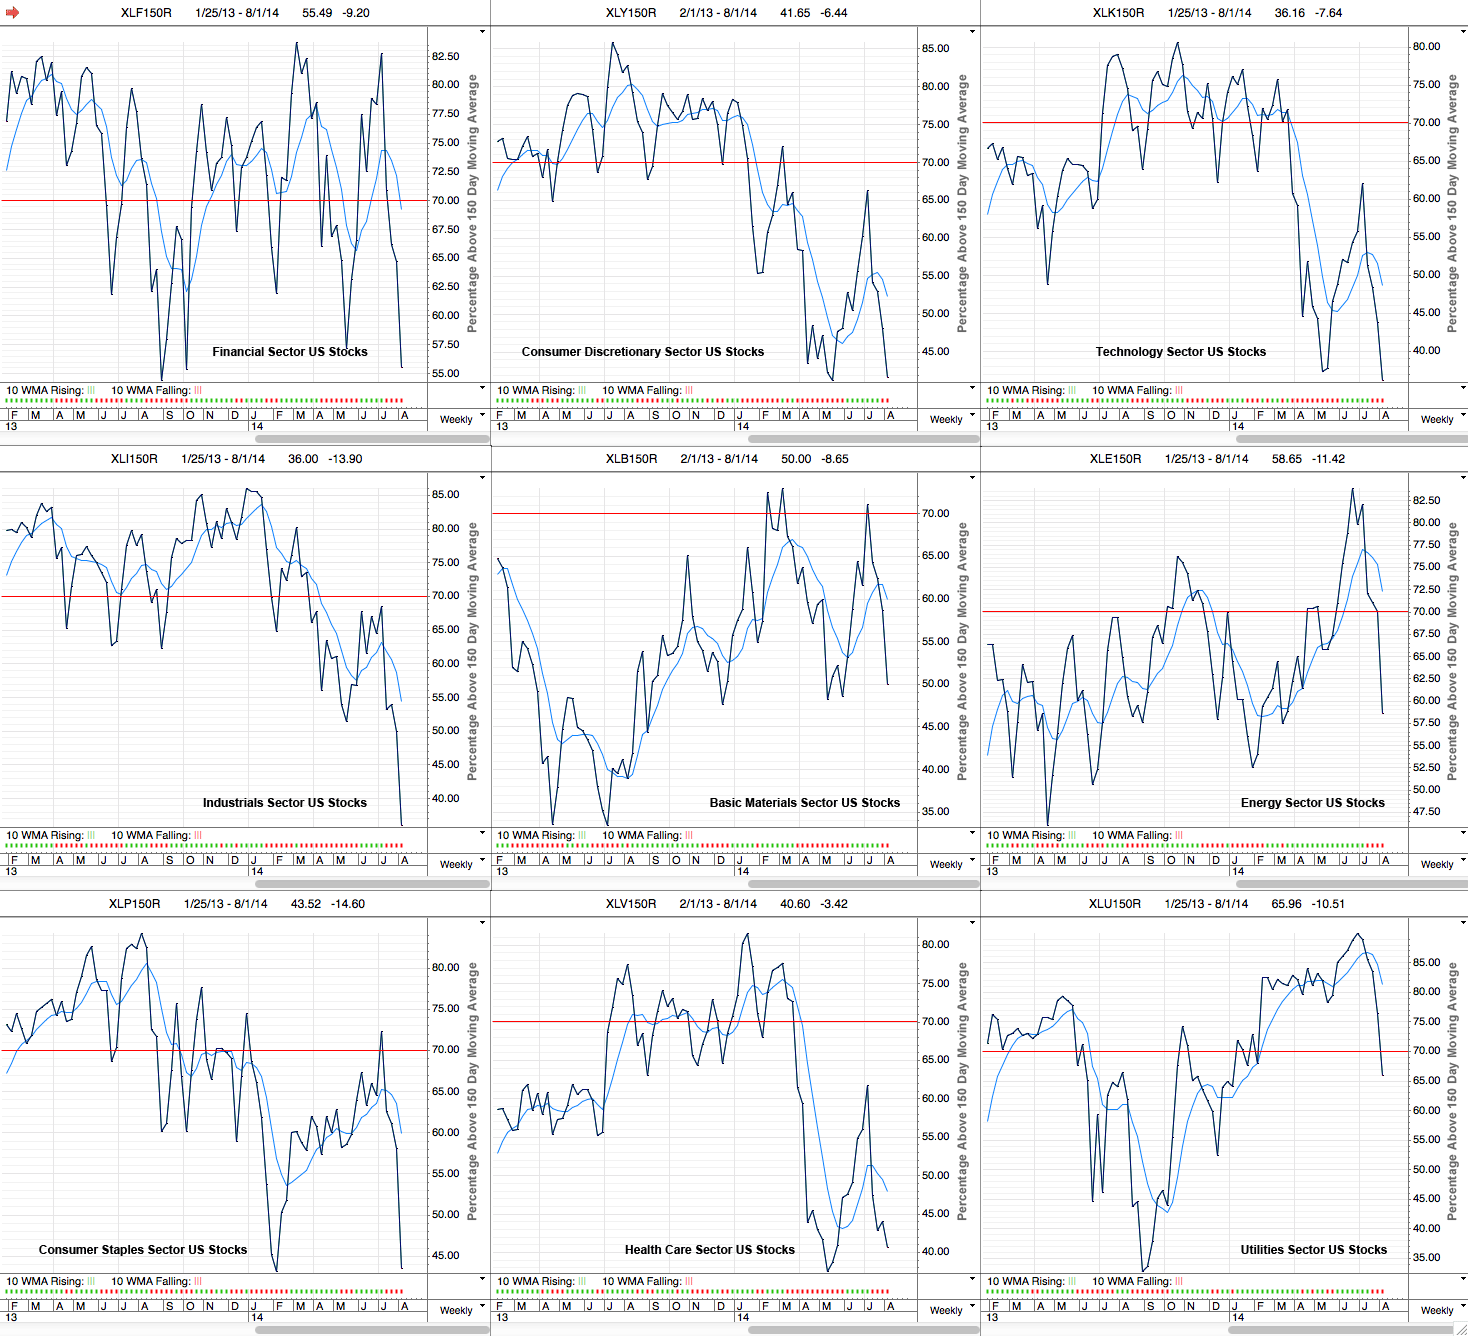
Below is the data table for the Percent of Stocks Above 150 Day Moving Average in each sector which I’ve ordered by relative strength, with the highest to the lowest percentage in each sector. Also attached is the visual diagram of the 9 sectors and the NYSE Percentage of Stocks above their 150 day Moving Averages line chart.
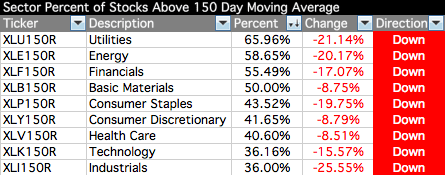
As you can see the US stocks continue to deteriorate with 5 of the 9 sectors now below the 50% level, and two, along with the Nasdaq market, in bear territory below 40%.
The average for the nine sectors is 47.56%, and so the internals are showing that the US market is a Stage 3 phase overall, but as you can see, some sectors are in worse shape and are moving into Stage 4. Whether the rest of the sectors follow them down is unknown, but the method doesn’t recommend buying during Stage 3, and so it’s a time to be more defensive, or consider shorting in the weakest areas of the market imo.