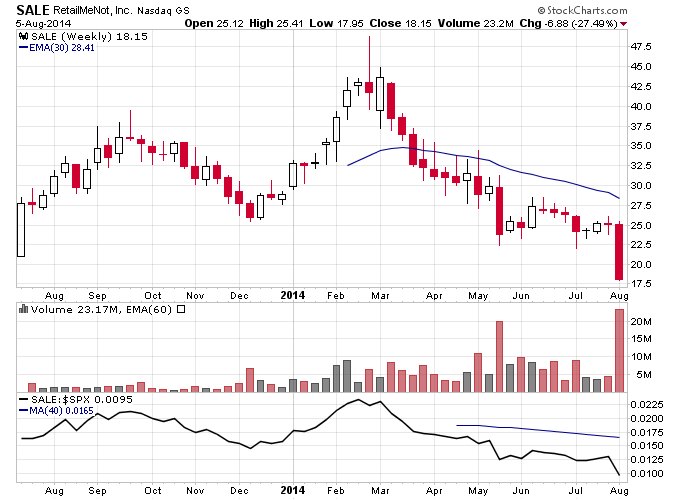
I’ve been saying this in a number of posts but froth in the stock market peaked way back in February. The chart of SALE is possibly the cleanest depiction of this. SALE IPOed in the middle of 2013, and proceeded to more than double into early 2014. And since then it has just been a steady smackdown and today it just got obliterated. You can see this pattern in a lot of frothy parts of the market though. Many biotech, Internet, and stocks that recently IPOed have been hammered starting in February and have barely recovered since then.
I’d put the stock market into 3 buckets of types of stocks:
1) Frothy stocks that have been obliterated and are down for the count (just rolling on the floor or still heading lower). Think stocks like FEYE, TWTR, ISIS etc.
2) Stocks that have tried to recover the February smackdown but are still below former highs earlier in the year. Things like IBB, PCLN, AMZN.
3) Stocks that have made new highs recently. There are very few of these left, things like UA, CMG, FB. There’s a lack of leadership in this market.
On a radio show I heard an analyst suggest that you should “hide” in the strong sectors of the market. That’s exactly how markets top, everyone tries to hide in the narrow leadership left, and once that goes the whole thing starts tumbling. Case in point look at the downside volume in energy lately, that was one of the last parts of the market showing any leadership.