A few weeks ago I noted that gold stocks were either crazy or right, because they were continuing to hold up despite gold and silver prices coming under pressure. Many gold stocks have taken a lot of damage since then and silver broke through support, but the gold and silver miners still are holding up much better than you would expect.
I believe this continues to speak for the gold bear market being closer to an end than most people realize. Let’s take a look at some charts of mining stocks and see.
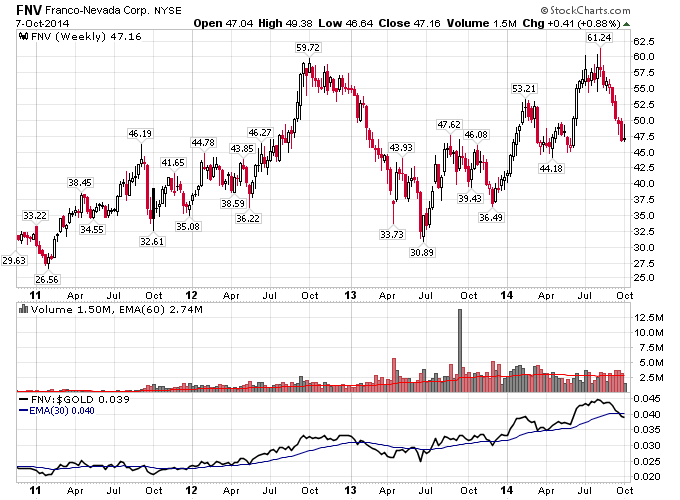
Frano-Nevada I think is the cleanest example of this. I included the price labels to note the high and low prices for Franco on the chart. Notice that ever since the major gold bottom in the middle of 2013, Franco has traced a pattern of higher highs and higher lows. This is in the face of continued pessimism in gold and gold stocks and with gold testing its lows a few different times, including recently. Franco just continues to buck the trend in gold which I believe is the telltale sign of a gold bottom coming.
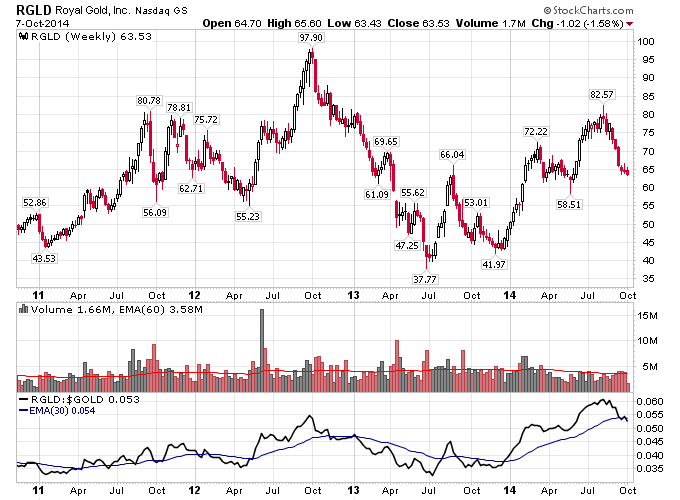
Royal Gold has a similar chart to Franco-Nevada. It made a low in mid-2013 with low in gold, then a higher low at the end of 2014. Then it has put in higher lows and higher highs in 2014 even with two failed rallies in gold.
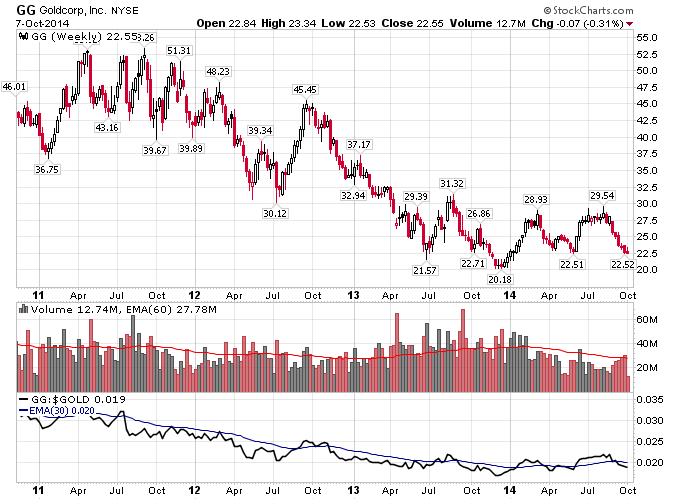
Goldcorp paints a picture that I think is very important to look at. First off Goldcorp traded in a volatile sideways range in 2011 which helped foreshadow the top in gold in 2011. Then Goldcorp started making lower lows in 2012 as gold remained weak. But gold only went sideways in 2012, and notice how Goldcorp continued to underperform gold in 2012 as evidenced by the relative strength chart against gold on the bottom. This was more evidence that the gold bear market was intact in 2012 even as gold tried to break out of its range. Once gold failed in 2012, Goldcorp crashed along with gold during 2013. But notice how Goldcorp made a low at the end of 2013, and has held that low in 2014 even as gold has remained weak. This has caused the relative strength chart against gold to start drifting upward in 2014, which is what you want to see if gold was really making a final bottom here.
So if gold were really headed to new lows to conclude 2014 and into 2015, we would not expect the gold miners to have performed so well this year against gold. Instead they should have continued to amplify gold’s losses on the downside, and should be trading at much lower levels relative to gold than they did in 2013. This positive divergence against gold for the gold miners is a bullish sign that you won’t hear anything of from the mainstream media.
Silver miners tell a similar story to gold miners. Even with silver making another new low recently, most silver miners have outperformed silver all year and most of them are refusing to make new lows along with silver. Take a look at some silver miners below.
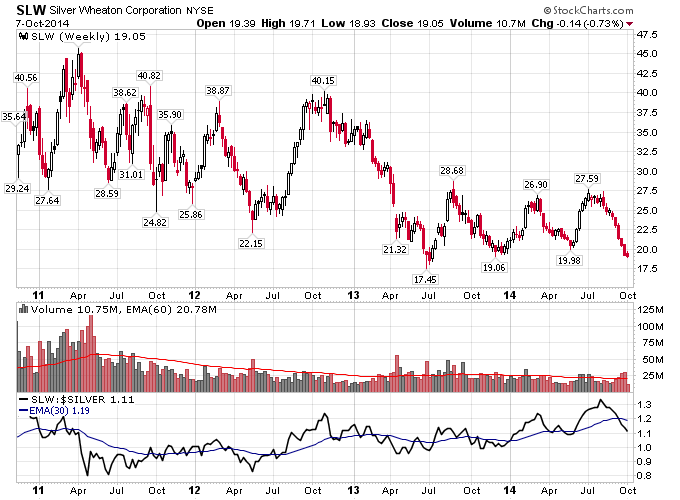
Silver Wheaton has actually bucked the downtrend in silver since the middle of 2013. You could even say it has held up against silver going all the way back to 2012. Notice on the relative strength chart we see a pattern of higher lows and higher highs since mid-2013, meaning that Silver Wheaton is outperforming silver. This argues for the coming end to the silver bear market.
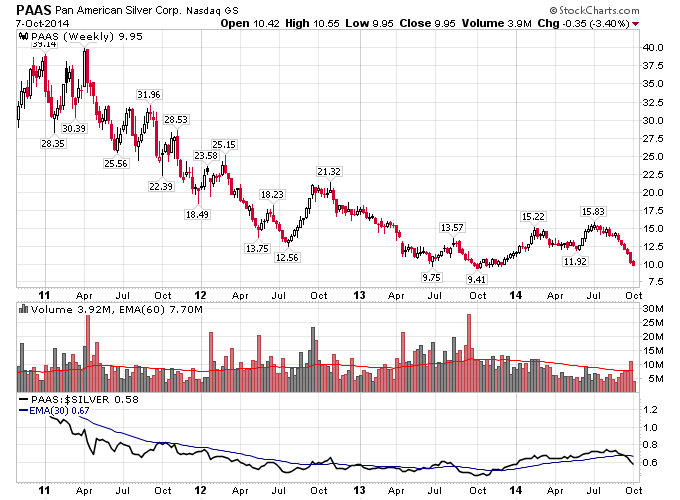
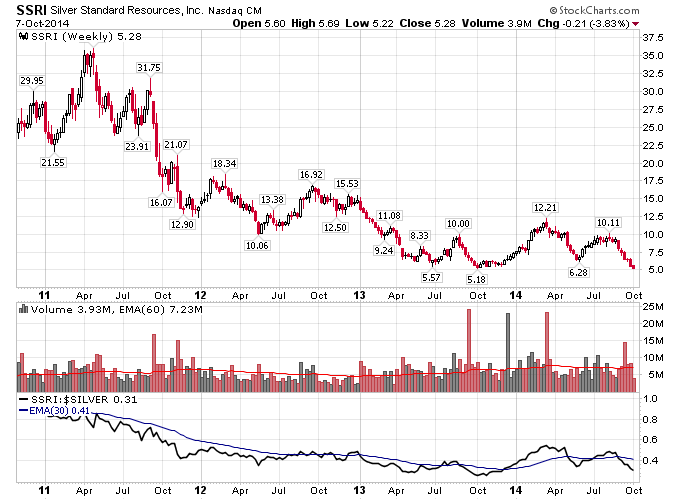
Pan American Silver and Silver Standard have similar charts, but the main point is that they both have outperformed silver all year in 2014. They both also haven’t made a new low even though silver has.
There are gold and silver stocks that have made new lows recently but most of the miners have showed major strength against gold and silver during 2014. This continued strength could be indicating that gold and silver are getting very close to ending their bear markets even as sentiment remains bearish.