Background
Stage Analysis is a strategy for longer term trend trading. It was discussed in detail by Stan Weinstein in the book Secrets for Profiting in Bull and Bear Markets. Stage Analysis uses chart patterns to describe four distinct stages that a particular trade can be in. The stage, and transitions between stages, have specific guidelines for whether a trader should buy, sell, or hold the trade. This creates a simple strategy to follow when trading the market. Stage Analysis helps traders identify and stay invested in long term trends in the market.
Key Components Of Stage Analysis
Weekly Stock Chart – Weekly charts are used in Stage Analysis since the system is designed to be for longer term trading, from weeks to months to years at a time. Stage Analysis is definitely not a system for day trading.
30-Week Moving Average – The price action on the weekly chart is compared in relation to the 30-week moving average in order to determine the specific stage in Stage Analysis. Whether the weekly price and the 30-week moving average are trending higher, lower, or sideways determines the specific stage.
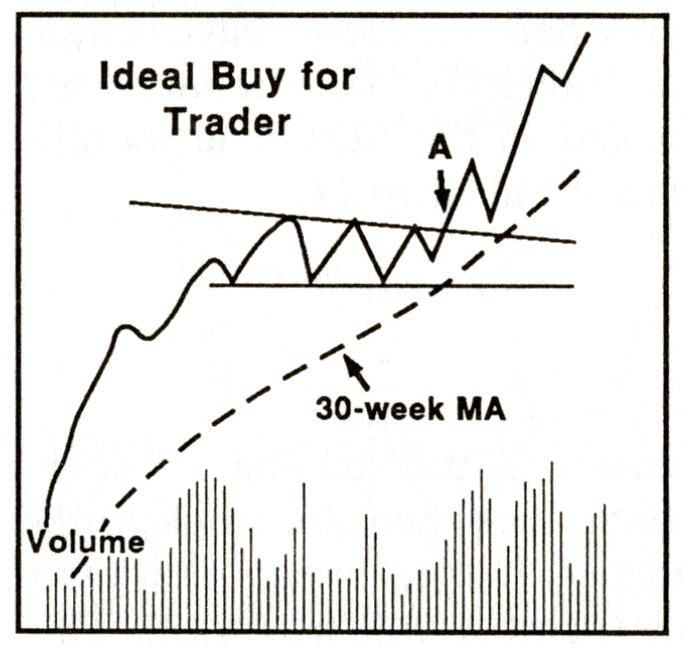
Volume – A key component of the transition from a Stage 1 base to a Stage 2 advance is big increase in volume on the breakout. Without a big increase in volume the breakout is more vulnerable to being a false breakout, and the market moving back down into a Stage 1 base.
Stock Market Indexes – The current stage of the overall stock market is extremely important when determining how much money to trade in the market and whether to even trade at all, or to stay in cash. When the overall market is in a Stage 4 decline, most stocks will also be in a Stage 4 decline and that is a period where a trader should play it safe instead of facing potentially devastating losses in the market.
Visual Example Of Stage Analysis
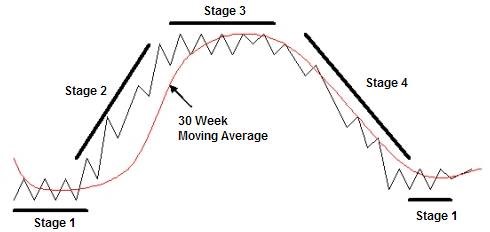
Source: Secrets for Profiting In Bull and Bear Markets By Stan Weinstein
The following discussion describes each stage in Stage Analysis, including examples from charts. Actions to be taken during each Stage are also discussed. For a more in depth discussion of Stage Analysis be sure to check out Stan Weinstein’s book.
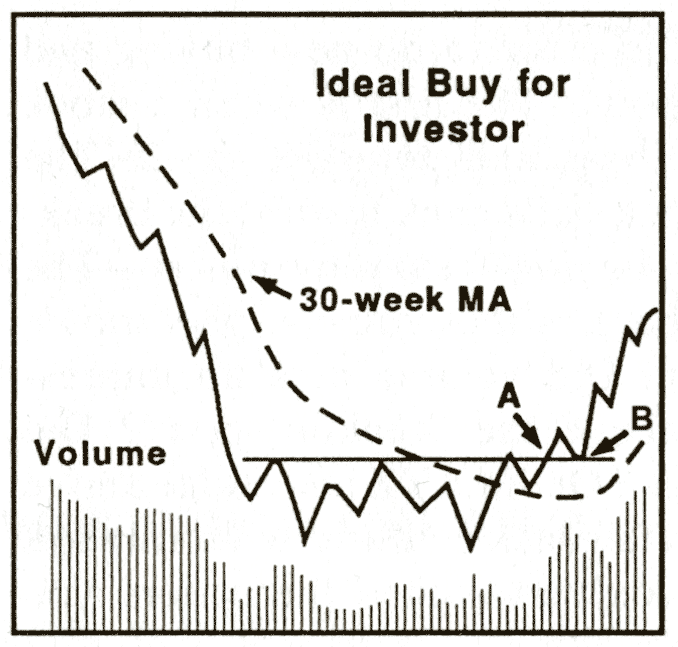
Stage 1: Basing Stage
The stock forms a long horizontal base on the chart. A base is simply a period where the stock moves mostly sideways instead of trending higher or lower. The base forms after a decline in the stock price. The longer the horizontal base the better. A long base will establish a more significant support level, and the ownership of the stock will transfer from weak hands to strong hands. The price action in the stock usually oscillates above and below the 30-week moving average while forming the horizontal base.
Actions to take in this stage:
1) Create a list of stocks in this stage, and set price levels where they would likely breakout into a Stage 2 advance.
2) Take a look at the sector the stock is in and see if the entire sector is also in the same stage. This will validate the breakout into Stage 2 if the entire sector moves with the stock.
3) Look for increased volume as the stock approaches the breakout level.
4) Do not look to take a position in stocks in this stage until the breakout into Stage 2 occurs. The reason is the stock can continue to be in the Stage 1 base for months to years at a time. Your capital will be tied up in a stock that is going nowhere if the stock stays in Stage 1 for a long period of time.
Examples
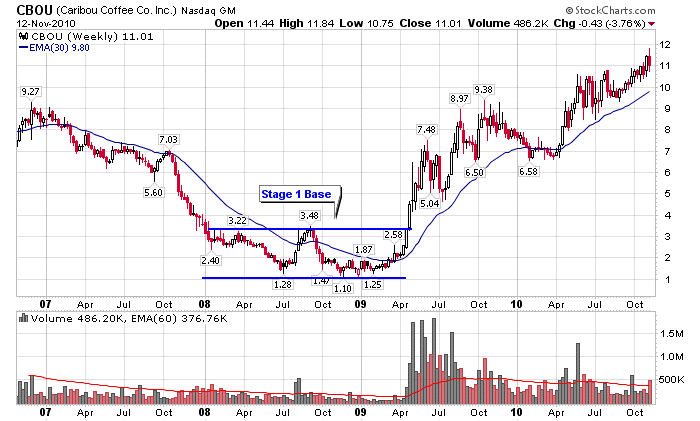
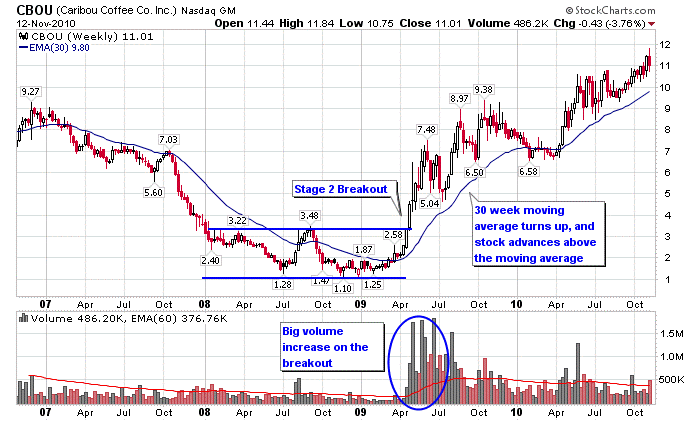
After a decline, Caribou Coffee (CBOU) formed a long base that oscillated between $1.25-$3.25. Notice how the 30-week moving average flattened out towards the end of the base.
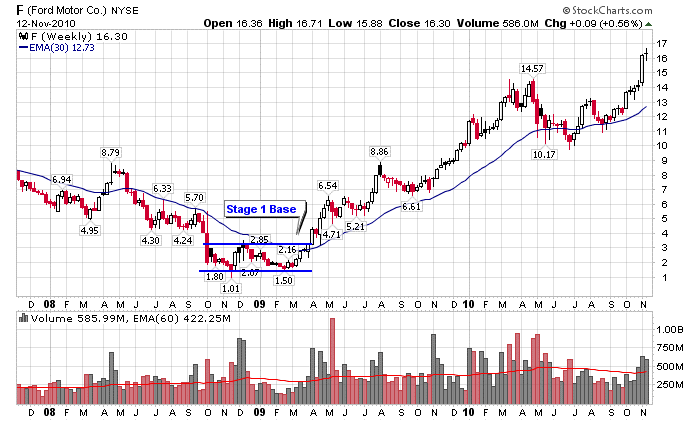
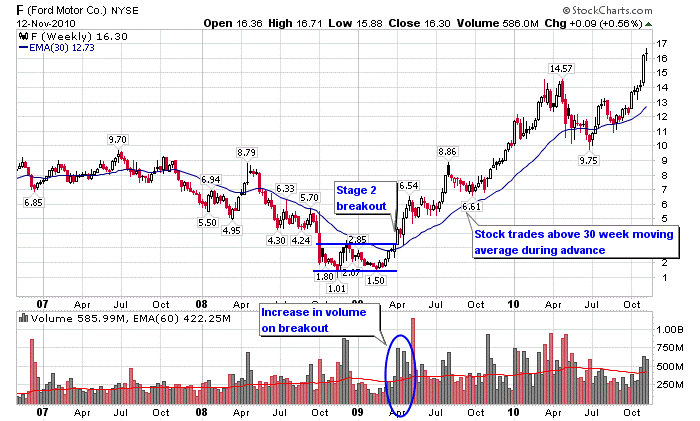
After declining during the 2008 bear market, Ford (F) formed a horizontal base that ranged from about $1-$3.
More Notes On Stage 1:
- Volume usually dries up initially in Stage 1, but can expand later in the base as more buyers come in. This indicates that large scale selling of the stock isn’t driving down the price which is a good sign.
- The basing in Stage 1 can go on for months to years
Stage 2: Advancing Stage
Besides recognizing a Stage 4 downtrend being able to identify a Stage 2 breakout and examine its quality is the most important part of the system. In Stage 2 the stock breaks out of the horizontal base and begins advancing over a period of time. While the stock moves higher, most of the advance should occur above a rising 30-week moving average.
What does a Stage 2 breakout look like?
There’s two types of Stage 2 breakouts. The first is a breakout from a Stage 1 base and this is simply referred to as a “Stage 2 breakout”. The second is a breakout from a consolidation within an existing uptrend, this is referred to as a “Stage 2 continuation breakout”. Both of these breakouts are considered to be the entry points in Stage Analysis where you would be buying a position. Here’s a visual example of both breakouts from Stan Weinstein’s book:
Example of a Stage 2 Breakout – Source: Secrets For Profiting In Bull And Bear Markets
Example of a Stage 2 Continuation Breakout – Source: Secrets For Profiting In Bull And Bear Markets
What are the attributes of a high quality Stage 2 breakout?
Analyzing the quality of the Stage 2 breakout is key using the criteria laid out in the book. The more a stock matches the attributes of a high quality Stage 2 breakout the higher the probability of catching a big winner.
- Trend Of The Overall Market
- The trend of the overall market needs to be higher for Stage 2 breakouts to really get going. If the trend of the market is down it can provide pressure on even the best stocks.
- Sector
- Studying the relative strength of a sector is a key ingredient of finding big winners. If a stock belongs to a sector it has a much higher probability of being a big winner if the sector is outperforming the S&P 500. There are special cases where individual stocks don’t belong to any sector or are so unique they don’t trade with the sector, and if that is the case then you can move onto analyzing the specific stock.
- Volume
- The breakout needs to occur on increased volume, ideally 2x average weekly volume for the breakout week, or 2x average volume in the weeks leading up to the breakout followed by an increase in volume during the breakout week. If there is poor volume during the breakout the breakout has a much higher probability of failing. Volume is critical to demonstrate accumulation of the stock by big money which helps the stock sustain an uptrend.
- Slope Of 30-week Moving Average On The Breakout
- The stock should be above a rising 30-week moving average during the breakout. This demonstrates that the stock has initiated its uptrend and is out of the sideways basing phase.
- Resistance
- In Stage Analysis we are interested in resistance from the previous 2 years of trading. The more overhead price action above the breakout during the past 2 years the more resistance a stock has. In my studies of past big winning stocks almost all of them are trading with no overhead resistance, so if you can catch a breakout with no overhead resistance that’s the ideal setup.
- Relative Strength
- The stock should be outperforming the S&P 500 on the breakout which means when you chart the stock against the S&P 500 the trend of that line is going higher. In Stage Analysis we are looking for the big winning stocks that drive the S&P 500 higher, and therefore they should be outperforming the market.
- Size Of The Previous Stage 1 Base
- The bigger the Stage 1 base the less resistance the stock will have, because more sellers will have left the stock putting the stock in stronger hands. Therefore the longer the base the better position the stock is in to sustain an advance because selling pressure has dissipated.
Actions to take in this stage:
1) The stock should be bought on the breakout or on a pullback to the breakout level.
2) The stock can be held until a Stage 3 top forms or a trailing stop is hit.
3) Trail a stop for risk management purposes. For example you can use the 30-week moving average as an area to trail a stop loss under.
4) The stock may setup again into a Stage 2 continuation breakout after the initial breakout. This is another opportunity to enter a stock within an existing uptrend.
Examples
Caribou Coffee (CBOU) from the previous example broke out of the Stage 1 base on a huge increase in volume. From the breakout point the stock continued to trend higher above the 30-week moving average.
Ford Motor (F) from the previous example broke out of its Stage 1 base on a big increase in volume and continued to trend higher above the 30 week moving average.
More Notes On Stage 2:
Checklist for Refining The Buying Process
Examples of successful and failed Stage 2 breakouts – TSLA, LK, NOG
Big winners in Stage 2 can take time to get going
Stage 3: Consolidation/Topping Stage
The stock starts to trend sideways in Stage 3 and lose momentum to the upside. The 30- week moving average also loses its upward slope and starts moving sideways. The price action in the stock usually occurs much more above and below the flattened 30 week moving average than it did in Stage 2. The stock will either breakdown into a Stage 4 decline after this stage, or after a consolidation break back into another Stage 2 advance.
Actions to take in this stage:
1) Wait for a Stage 4 breakdown to sell the stock, or just sell the stock in this stage if the technical action starts to form a significant top.
2) If the stock happens to break back into a Stage 2 advance, buy the stock back or add more shares if they still hold the position.
Examples
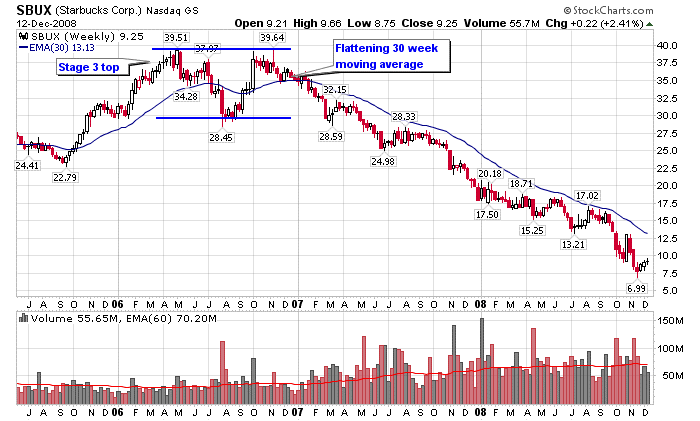
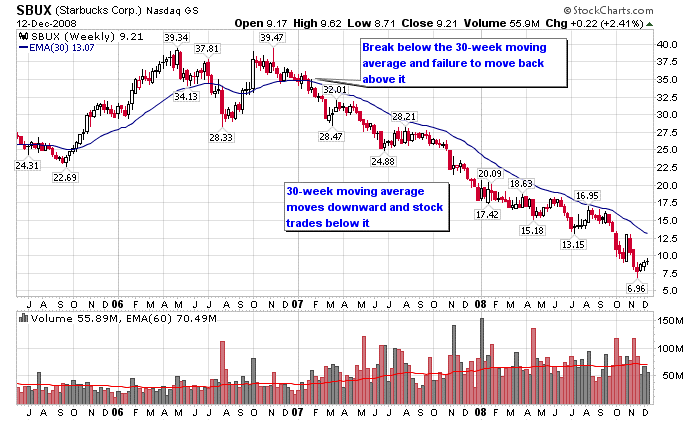
Starbucks (SBUX) formed a Stage 3 top after advancing for a period of time. The 30-week moving average flattened out in 2006 and the stock began oscillating above and below the moving average.
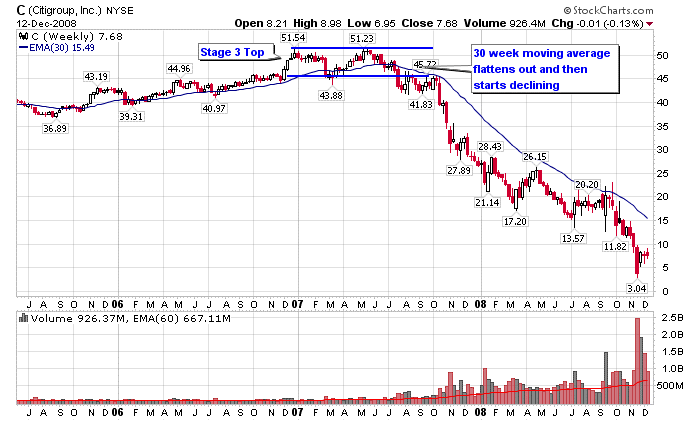
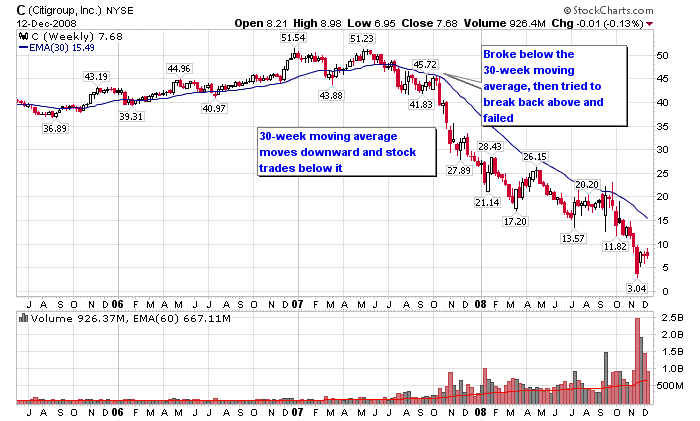
Citigroup (C) formed a Stage 3 top in 2007 when the 30-week moving average flattened out. The price of the stock moved above and below the flattened 30-week moving average during this time.
Stage 4: Declining Stage
The stock breaks down below Stage 3 trading range and below the 30-week moving average in Stage 4, and continues to decline mostly below the 30 week moving average. The 30-week moving average begins a long slope downward.
Actions to take in this stage:
1) Sell positions during the transition into this stage, since they can lose considerable value if held during a steep decline
2) Stay out of all stocks in this phase
Examples
Starbux (SBUX) from the previous example permanently broke down below the Stage 3 consolidation in early 2007 and began a long term decline.
Citigroup (C) broke down below the 30-week moving average in the middle of 2007, then retested the 30-week moving average and failed to move back above it in October 2007. The 30-week moving average then began sloping downward and the stock began a long Stage 4 decline.
Stage Analysis of the Overall Market
Since the majority of stocks rise and fall along with the rest of the stock market, it is very important to know the stage the major market indexes are in. Most stocks will trend along with the rest of the market. If the major indexes are in a Stage 2 advance, you can expect the majority of stocks to also be in a Stage 2 advance. The most important thing to keep an eye on is when the overall market transitions into a Stage 4 decline. Since most stocks will be declining along with the rest of the market at that point it would be prudent to get out of long positions and stay conservative while the market declines.
Key Points
- Avoid buying stocks in Stage 1 bases until they breakout into a Stage 2 advance, as sometimes capital can become tied up when a stock bases for a long period of time
- The best opportunity for buying comes on the breakout from Stage 1 to Stage 2
- Stage 3 consolidations can either form a top and lead to a Stage 4 decline, or simply a trading range that develops into another Stage 2 advance
- Never hold a stock that is in a Stage 4 decline as it can lead to major losses
- The stage of the overall market has a big influence on individual stocks since most stocks follow the trend of the market
Quotes From Stan Weinstein
For a longer list of quotes of Stan Weinstein check out this page. Here are some of my favorites:

Great addition to watchlist with quick charts
Thanks Thomas! I wanted to embed stockcharts.com charts but they don’t let you do that, so I had to go with Yahoo.
Nice information. Thanks for sharing. You can try this Technical Analysis Charting Software for more details about stock market.
Whats up you old pingback…what a name!
Thomas……!
See you made my day…..good analysis.keep it up
Hi, this is great! I’ve been trading very successfully with Weinstein’s techniques and would love to discuss stocks with like minded investors. Are you aware of any chat forums etc where I can go?
Hi Harkant, here is a forum that covers Stan Weinsteins staged analysis. It is very good…
https://stageanalysis.net/
Thanks
Hi Justin, you’ve done a really great job with the Screener. I wonder if you can tell us how you managed to program such a terrific tool and why you use daily instead of weekly charts.
Thank you and happy new trading year!
Hi Roberto,
Thanks I’m glad you like the tool. My background besides trading is in software development so that’s how I was able to get it developed. I use weekly charts because of the Stage Analysis system that I use to trade. I would highly recommend checking out my Stage Analysis page for more information on how the system works if you’re interested! Thanks and happy new year to you as well.
Stan Weinstein’s book is one of my absolute favorites. I also recommend Justin Mamis’s books–most particularly The Nature of Risk. You may also be interested in Wyckoff, who initially propounds this method of analyzing stocks. Wyckoff uses the model of the “stock operator” and provides more color as to what is happening in accumulation and distribution phases.
I might also suggest that you put a volume @ price overlay on stockcharts. These bars show where there is aggregation of volume at specific price points.
Further to use Stan’s method, plot price performance. I like to use the stock price performance against the price performance of the industry that it is in, and in evaluating the industry, use the industry price performance against the broad market index (e.g. $DJUS).
I’ve pulled my copy out that I’ve had for many years. Good buying/selling advice never goes out of style. I believe that investors/traders are well served by these systematic, objective and rational approaches to the market. Thanks for your contribution to the discussion and the excellent exposition of his methods.
Thanks for the feedback! I have read Mamis’s books but I haven’t read Wyckoff. I did read a book though that talked about his exploits as a trader. I agree evaluating performance of a stock against its industry is a useful indicator. Definitely agree that Weinstein’s advice doesn’t go out of style, I re-read the book at the start of every year!
What a wonderful website and thanks for putting all this together. I came across Weinstein’s techniques recently and this website really compliments them. Thank you.
Thanks Tim glad you like the site
Hi everyone,
a very basic question.
I’ve read the Weinstein’s book but I can’t find a clue regarding the need to use both weekly AND daily charts to operate in the markets. In the book, it seems he always refers to weekly charts, but reading several forum, it seems that we should operate with daily charts too. I’ve been following Elder’s Triple Screen for years, but eventually I’ve found more suitable for me to avoid all the “noise” of daily charts and switch on the weekly (50 periods), with a small window for a yearly chart (10 periods).
Many thanks,
Roberto
Hi Roberto,
I usually only use daily charts to refine entry or exit points based on support and resistance levels. Weekly charts are better for identifying trends and understanding what stage a particular market is in.
I found this site from a Youtube video. One of the best explanation on Trend following. You have broken it down concisely and simple as 1-2-3-4. Thank you!!!
Thanks Tony I appreciate the comments
Good day!
Just wanted to clarify on the 30-week MA, does that mean its 150-day period MA? (In our case its 5-day a week open market) I’ve been trying to put the indicator but the 150(period) EMA doesnt seem to “stick” to the candlesticks as compared to a 30(period) EMA. Thank you!
Yes 30-week MA equates to a 150 day MA. Thanks for visiting the site!
hi I am an Italian trader, and I apologize if I don’t speak English well.
my question is the following, just as phase 3 can go to phase 4 or to a new phase 2, phase 1 could also continue in a new phase 4 and no in phase 2.ioe the price could continue to fall and not necessarily go up.
thank you
Yes anything is possible so a stock that is in Stage 1 could break down and go into Stage 4. Stage 3 could breakdown into Stage 4 or breakout into Stage 2.
hello justin thanks for the answer at this point I think that the Weinstein method is not very original because it does not bring any novelty to the classic breakout strategies. The markets move 70% in the lateral phase (phase 1-3) then they break up or down continuing a pre-existing trend or starting a new one in the opposite direction (phase 2-4) Everything focuses on identifying the direction of the breakout with the same resources (volumes, supports and resistance demand and supply, hyper-over-bought etc . etc.)so what do you think is different between breakout strategies and the Weinstein method?
Hi salvatore no problem thanks for your inquiries. I like the “Weight of the Evidence” approach that Stan discusses where you first start with the indexes and then move to the best sectors and stocks in individual sectors. If the indexes aren’t acting well then it’s best to remain defensive and wait for a better market. I’ve seen this play out over and over and the wisdom of Stan’s method holds true through every cycle. I also think the #1 point of not holding a Stage 4 stock is critical to long term success. To many people ride losing stocks down and lose too much money instead of cutting their losses. I also like the simplicity of having 4 stages and having it be as easy as glancing at a chart with the right settings to see what Stage an index or stock is in.
Hi Justin, I wanted to see if it is possible to address my concern regarding stage 1 base formation.
There are times when stage 1 base does not form in a constructive manner; it moves to a support in a climactic manner, and then moves up quickly, which then it may form a base after moving up instead of dropping down to retest the prior lows from previous downtrend.
How can one interpret this?
Would it be still called stage 1 base, or stage 2 without a proper stage 1?
Thanks alot!!
Hi Nigel,
It’s certainly possible for a stock to just have a V-bounce from a Stage 4 downtrend and not form much of a Stage 1 base. Or I’ve seen cases where something starts to V-bounce into Stage 2 and then it fails and forms a larger Stage 1 base that may not retest the lows. The way I look at it is I would trust a stock less to move back into Stage 2 immediately after Stage 4 but recognize that it can happen. Usually the resistance from bagholders keeps pressure on the stock which is what creates the Stage 1 base.
I have been attempting to swing trade for about 16 month. I have learned a lot but unfortunately for me I am yet to be profitable (but have not lost too much) Along with better money management/discipline rules I recently have been learning more on stage analysis and it has opened my eyes and started to bring a lot of other pieces to the puzzle together for me. This site and your work has been helpful. Hopefully from here I can become consistent with my trading.
Thank you for your time and value!
Jason
That’s great Jason! Glad you like my site and are getting value out of it!
Hi Justin,
I see that, in the screener tool, the is set to 9 week as default value, while it is supposed to be a 30-long period. Just a bug in the software or is there a rationale?
Many thanks,
Roberto
“…the EMA is set…”
Sorry,
R.
Hi Roberto,
This is a limitation on the free software I am using to show the chart. I’ll double check and see if I can change it to 30-week now. Thanks!
I think you use Stockcharts! But how do you measure RS line, Stockcharts have sctr line, I dont think that is relevant to stage a. Investor daily has it and chartmill.
I have used Elders method for 2 years without succes, I like Stockcharts clean charts.
So I only use ema and voulme
Hi I don’t use the RS line in my charts, only the MA and volume! Less indicators often makes the picture cleaner.
Thank you for the nice summary
Cheers!
Hello Justin – I happened to see your YouTube video and landed in this website and went through it. Very informative and Thanks for taking this up. I see the screener as something that is extremely useful – however, I am based out of India and trying to see if it can be extended for countries other than US. If there is a possibility, would be more than happy to understand how it can be setup for Indices, Stocks in other countries like India as manual “Stage” screening is quite tough.
Alternatively, if there are any Stage Analysis websites/ screeners available for Indian Indices/ Stocks, please do let me know.
Thank You!
Hi Raj,
Thank you for your interest! The screener is not setup to take Indian stocks at the moment and I’m not doing any new development on it at the current time unfortunately. Cheers!
Hi Justin, I’m in the middle of the book and I feel this method to TA is much more clear and easy to understand than others. I do like your idea of re-reading co trading books. I hope you don’t mind me asking a basic question when we set up a stop loss on the brokerage side is that a stop limit where we add the price range or a trailstop, limittrailstop. I’m reading stuff online about each and everyone has their preference but I want to follow Stan’s idea. Thanks!
Hi Michelle yes trailing stops are what Stan Weinstein is talking about in his book. Whether you use limits or not is your preference. Thanks!
Hi Justin Thanks for getting back to me. So we’d let it trail but every so often tighten/review it up from each swing low? Also, how would you get an uneven number if it’s trailing/price changes? I currently have a stop at 5% Do you prefer dollar vs percentage? Percent is easier and I don’t have to calculate it but book said don’t use percents. Thanks again!
Screener is awesome! Nice work If you ever need a designer let me know 😉
Hello Justin! I was looking for more content from Stan’s philosophy and didn’t find many on the internet (strangely) until I finally found your site (I found your site by watching a video of you on YouTube). Excellent content, congratulations! Can you tell me how Stan is today, he continues to trade, has he stopped trading, if he teaches classes, seminars, things like that?
Hi Fabio I actually do not know how Stan is doing unfortunately. I do not know him personally but I do know someone who has interviewed him so maybe I will reach out to see if they know. Thanks for the question though!
I see. Could you tell me where i can find this interview? The only interview I found was him being interviewed in 1987 (black monday). It’s been a while hahaha
Hi Justin,
Very informative website, I really like the Screener.
I kinda understand the visual of stage analysis but wonder if you could share how you (programmatically) label the stock as being in stage 1,2,3, or 4 and how many weeks it has been so?
For example, if the Screener say stocks XYZ has been in stage 2 for 3 weeks, what criteria do you use to determine week-0?
Thanks
Hello:
There is a mention of a few stocks transitioning from Stage 3 back into Stage 2. Are there any recent examples of this phenomenon. And how do we identify or conclude that the stock is not getting into Stage 4 but headed back to Stage 2 instead. What are the typical cues?
Hi Krishna great question. The stock needs to complete a Stage 2 continuation breakout on volume to move from Stage 3 back into Stage 2. The stock needs to move back above the 30-week moving average first, then breakout above resistance, and the breakout should be on 2x average volume for the week or higher.
Just found your website and man it looks like a diamond in the rough.
I love your screener I believe in stage analysis and would live to see you put the volume profile and the CCI indicator on here as well.
Thanks for sharing.
You could see if you can put Chartmill on as one of your chartings sites as well.
Hello sir please give some books name which help me to do swing and positional trading ..thank you
Secrets For Profiting In Bull And Bear Markets is a good start!
Hello Justin,
Saw you on twitter speaking with Patrick & Kevin.
You have Premium Newsletter.
At $400 for some novice and a very infrequent trader (based in UK so would primarily trade UK stocks & metal in GBP.
Patrick & Kevin are offering half price option. Would you consider such an option?
Hi Dipak,
I really appreciate your interest and thanks for watching the podcast! I’m offering a discount on the monthly newsletter currently at premium.nextbigtrade.com/launch, and in order to be fair to other subscribers I’m just going to keep that in place for now.
Hi Justin! I congratulate you on the work done, the information on the site is very useful. I have a confusion, as I am at the beginning of the trader’s path, something is not clear to me: Stan Weinstein talks about using the 30-Week Moving Average, but on your weekly charts EMA 30 appears, it should not appear MA 150 days (30 weeks) ? Thank you in advance for your reply and I wish you a pleasant day!
Thanks! Yes I like the EMA better personally but I believe either version of the moving average is ok. The EMA reacts faster to recent price action.