Here’s an updated chart of Twitter which closed at the high of the week last week and made a new 52-week high.
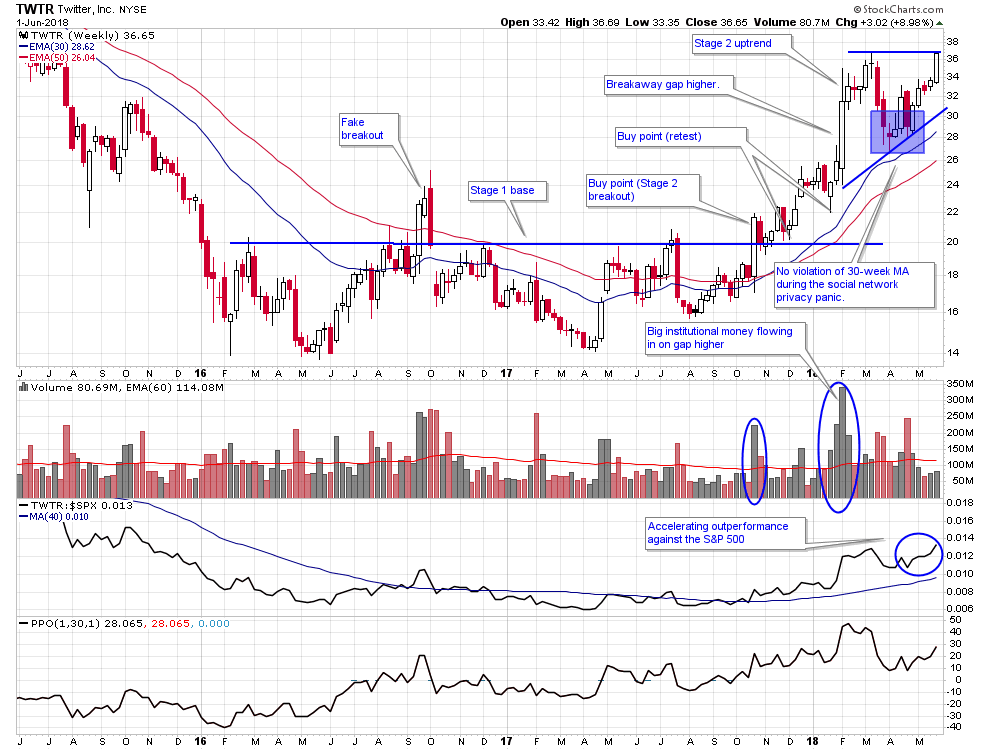
Just to recap what has happened with this stock:
- It broke out of a Stage 1 base back in October of 2017.
- Then it really surged higher in late January 2018 and drew huge institutional-type volume after an earnings report.
- Then in late March and early April we had a mini-panic in social media stocks but notice how Twitter stayed above its 30-week moving average during that downturn. This is important because Stage Analysis allows a stock to have normal price fluctuations and pullbacks above the 30-week moving average, so there was no reason to sell back then based on Stage Analysis as the stock remained in a Stage 2 uptrend.
- Now the stock is breaking out again to new 52-week highs and notice how it is accelerating its outperformance of the S&P 500.
Now the power of Stage Analysis is in the simplicity of the framework as far as staying in long term trades. What we’re looking for is the strongest stocks in the strongest sectors when the major indexes are in a bull market. Often times the strongest stocks will trend above the 30-week moving average for months to years and produce huge winning trades. One such example is Square which broke out of a Stage 1 base back in August 2016, and after a retest of the 30-week moving average in October 2017 has been in a Stage 2 bull market ever since. You can check out this stock at the Stage Analysis Screener and see that has been in Stage 2 for 89 weeks now!
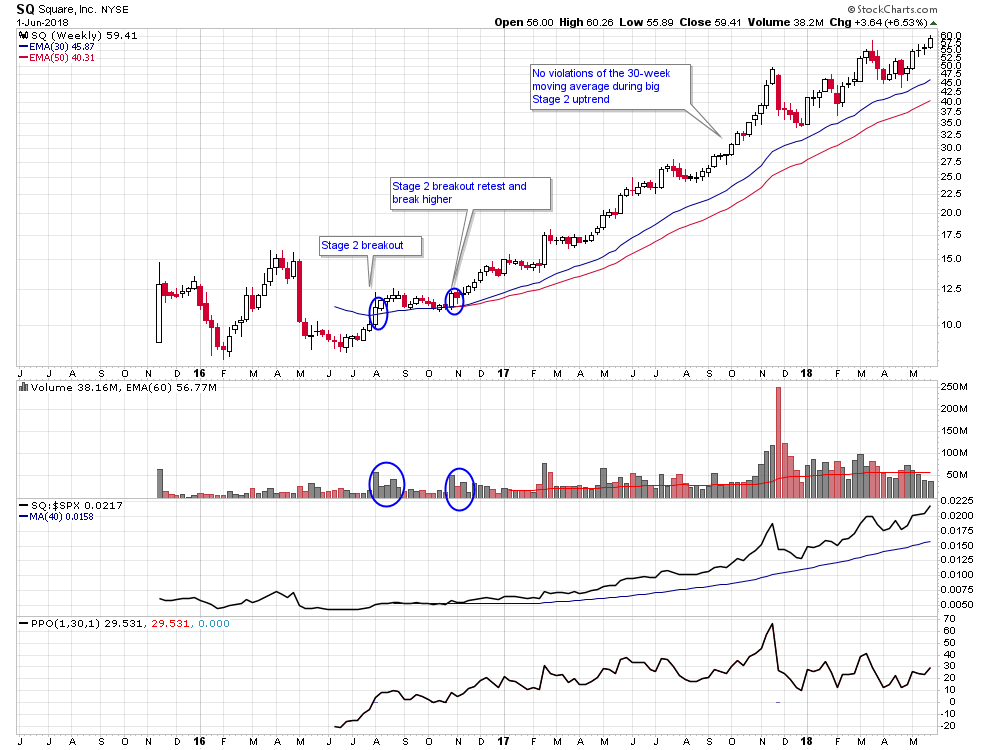
Of course there is no way to predict whether Twitter will perform as well as Square, but all that is really important is whether it continues to rise above a rising 30-week moving average. If it keeps doing that for a year or longer it could be a big winner just like Square.
Disclosure: I am long shares of TWTR.
Check out my Stage Analysis Screening Tool at: http://screener.nextbigtrade.com
Check out my trading videos on Youtube
Twitter: @nextbigtrade
The original article and much more can be found at: https://www.nextbigtrade.com
The views and opinions expressed are for informational purposes only, and should not be considered as investment advice. Please see the disclaimer.