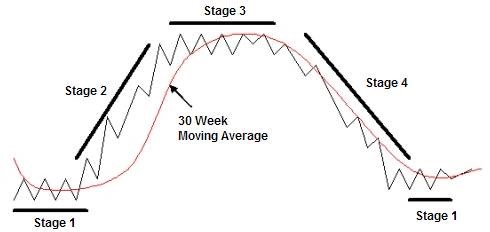
When actively trading the stock market its important to have realistic expectations for how stocks and the overall market behave. That’s one of the reason I use Stage Analysis, human emotion and its influence on supply and demand doesn’t change over time, and we see the same pattern (the 4 stages of Stage Analysis) repeat over and over in the market.
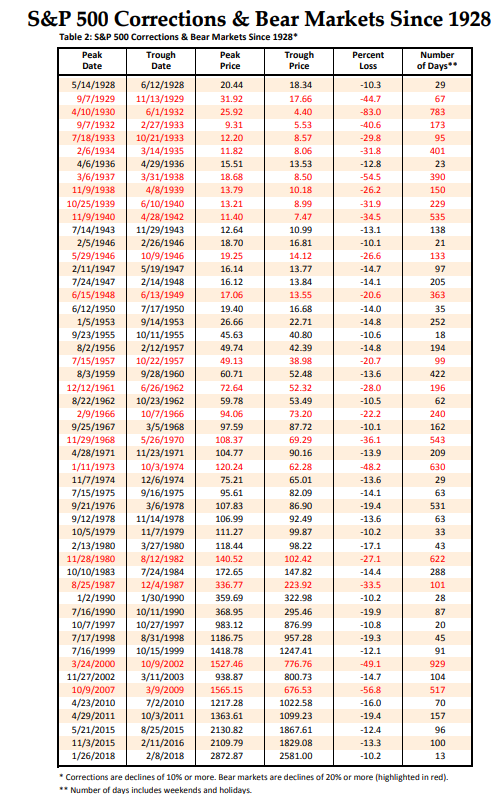
When thinking about market corrections I like putting them into 3 buckets, 5%, 10%, and 20+% corrections (a 20+% correction is also commonly referred to as a bear market). The table below shows 10% and 20+% corrections since 1928 (minus the late 2018 correction).
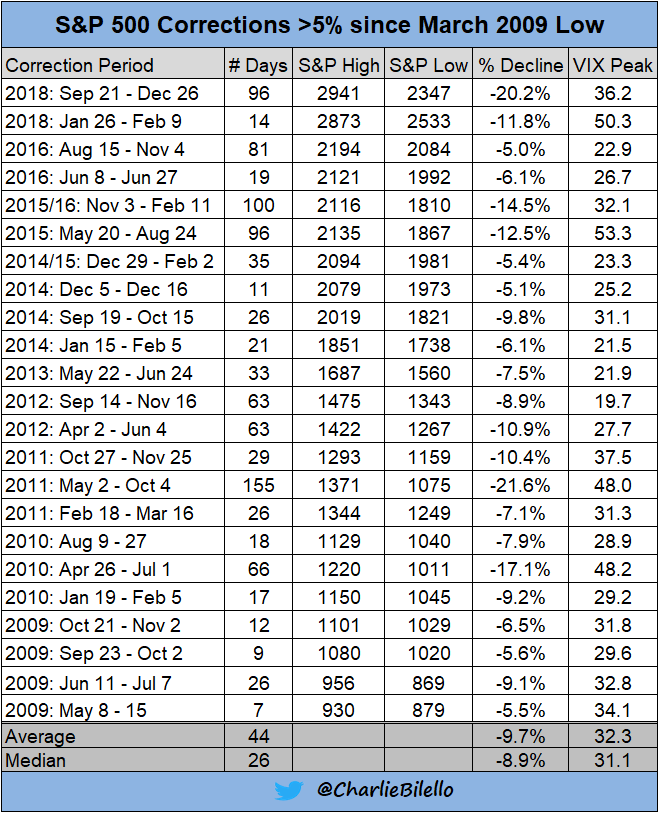
The next table shows 5%+ corrections since the March 2009 low. As you can see when you drop to that threshold you get much more frequent activity.
From this data the basic framework I’v created for stock market corrections is the following:
- 5% corrections happen almost every year, and we can expect on average 2-3 of them a year.
- 10% corrections can happen once a year every year or every few years.
- 20+% corrections are more rare and the market can go a long time between them, 10+ years in some cases or sometimes just a few years.
So in general we should be expecting to see a few 5% corrections a year. Even a 10% correction should basically be expected but should happen fewer than 5% corrections. A 20+% correction is a more rare event that we can expect to have multiple years between.
5% corrections are essentially profit taking events when the market is in Stage 2 and enough selling pressure comes in to bring the market back down to the 30-week MA. The course of action I like to take for 5% corrections is to reduce position sizes, that keeps me exposed to the market but lessens the blow of a market pullback.
Some of the ways that I’ve discussed in the past to detect a potential market pullback include:
- Divergences in key ETFs making lower lows while the market is moving higher
- Leading stocks attempting breakouts and failing
- A lack of new leading stocks to power the market higher
In general the things mentioned above become more prominent the more you move into a 10% and a 20+% correction. Also in a 20+% correction the market typically moves into Stage 4 where you would want to be out of the market with very little opportunity to make profits on the long side.
Get more info on Stage Analysis or Stan Weinstein’s book
Check out my trading videos on Youtube
Check out my Stage Analysis Screening Tool at: http://screener.nextbigtrade.com
Twitter: @nextbigtrade
The original article and much more can be found at: https://www.nextbigtrade.com
The views and opinions expressed are for informational purposes only, and should not be considered as investment advice. Please see the disclaimer.